Mission
Molly and I sell lots of digital downloads to customers in niche, underserved, and emerging markets where there is less competition and greater demand (when compared to markets that are already too heavily saturated).
Here’s how we find those niche markets with lots of want and less competition.
Strategy
We first identify what it is people are looking for the most, what search terms are trending upwards the fastest over a long enough period of time that we’re not wasting effort on passing fads.
Tactic
The first tool we use for identifying trending interests is Google Trends (trends.google.com).
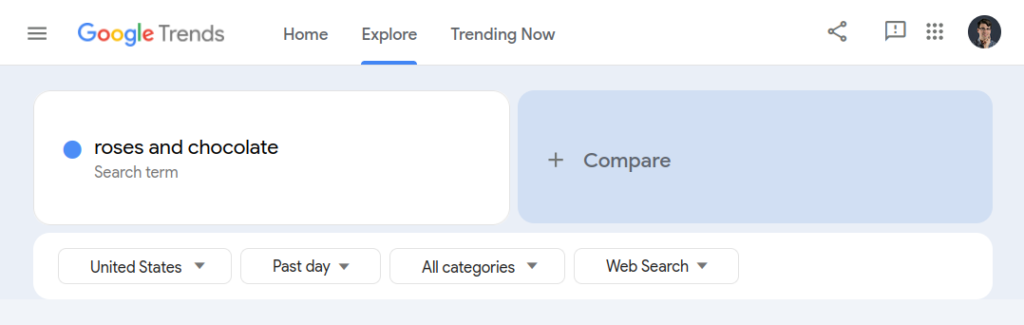
After visiting Google Trends, we start our search by entering some broad term into the search field and click Explore.
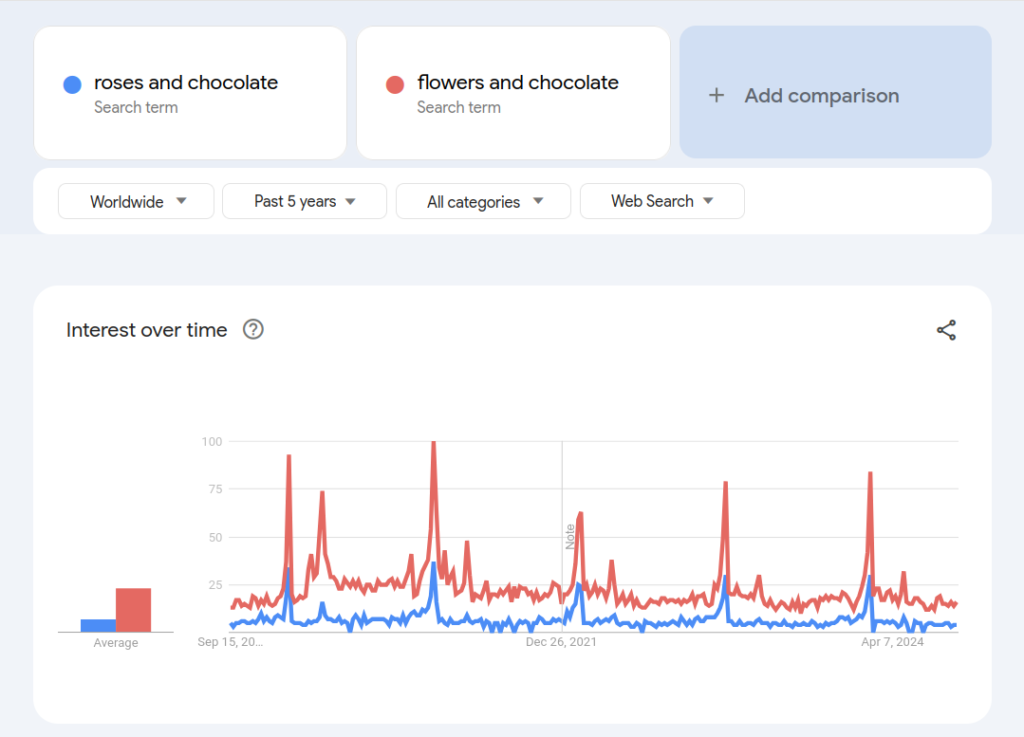
Next, we set our search parameters for Country, Period, Category, and Google Property. In our example, we set Country to “Worldwide” and Period to “Past 5 years” and we kept Category as “All categories” and Google Property to “Web Search”.
Then we check our search term’s volume: We try various search terms and note which reveal upward trends in the line graph indicating Interest over time. Steady or increasing interest indicates a stable or growing niche, while declining interest suggests the niche might be losing popularity.
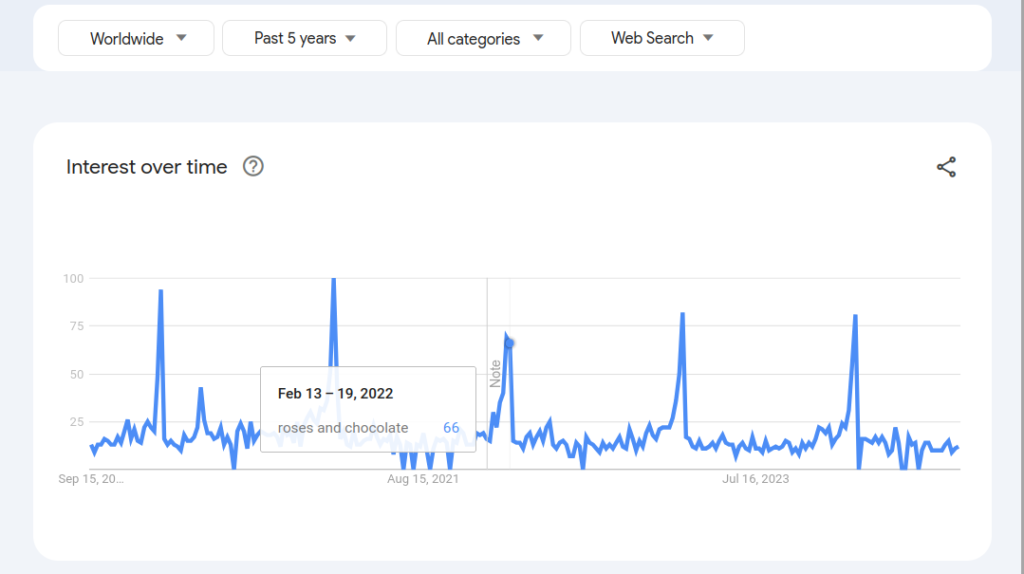
Watch for terms displaying interesting seasonal patterns. Some niches may have periodic spikes, such as holidays or trends related to specific times of the year. For example, our term “roses and chocolate” tends to spike each February on Valentine’s Day. This helps us time our marketing and product launches.
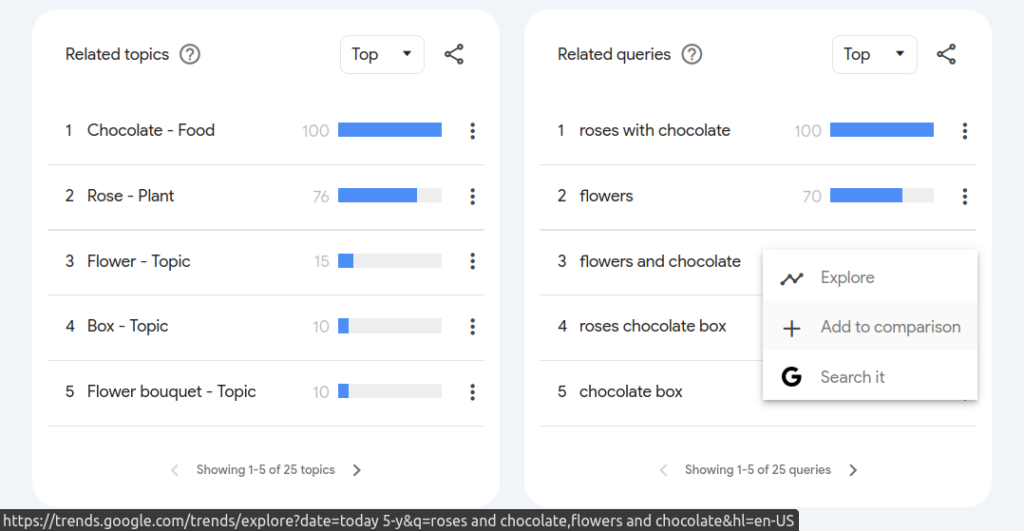
Compare two to five additional terms. For suggestions, add rising terms from Related topics and Related queries at the bottom of the page. Try switching between “Top” and “Rising” views. These can offer insights into new sub-niches or related products and services that people are just starting to search for.
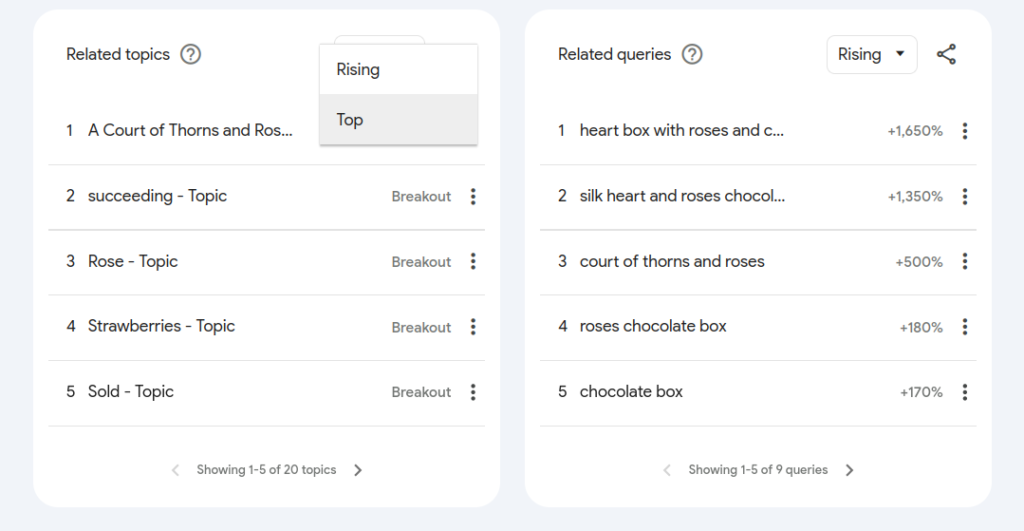
But watch out for terms with “Breakout” status. If you see “Breakout” instead of a percentage, it means that the search term grew by more than 5,000 percent. “Breakout” terms could have such big increases because these topics or queries are new and had few—if any—prior searches. You’ll need to discern whether these are newly emerging trends or soon-to-vanish fads.
Google Trends lets you compare multiple search terms at the same time so you can see which niches are performing better and growing faster relative to each other. Note which terms trend upwards at a greater incline than the others over a duration of time—these reveal faster growing markets.
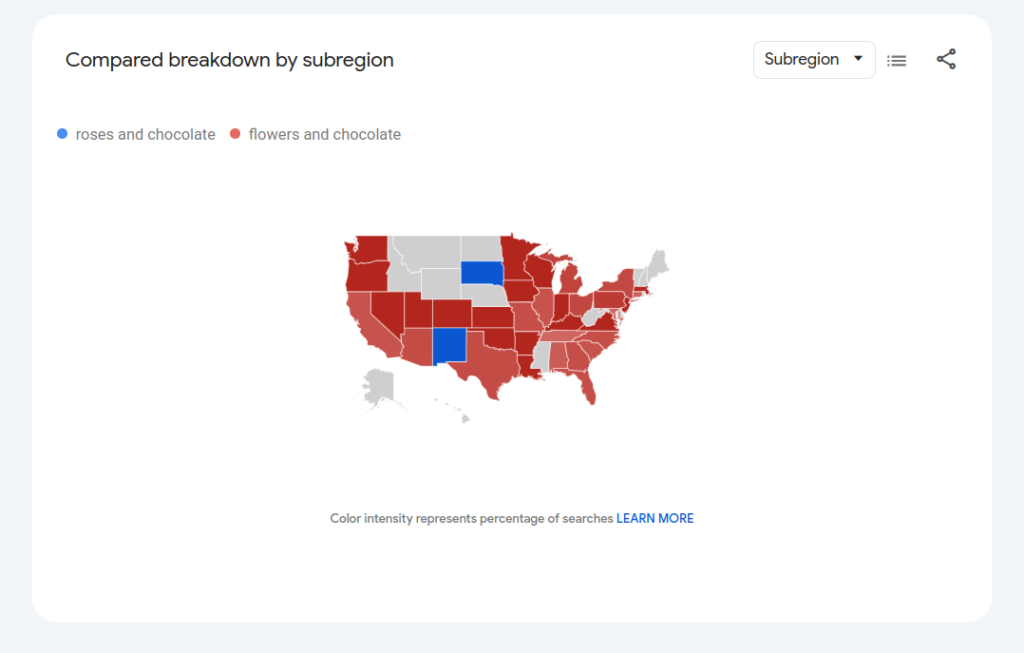
Play with your timeframe and geographical parameters: Try setting your Period to “Past 12 months” or your Country to “United States”. Try comparing different periods and detect trends over longer durations to ensure a niche has longevity and not just a temporary spike in interest. Try finding regions and countries where your term is more popular—areas of high concentration in the Interest by region (or subregion) map view. These are places you could consider targeting.
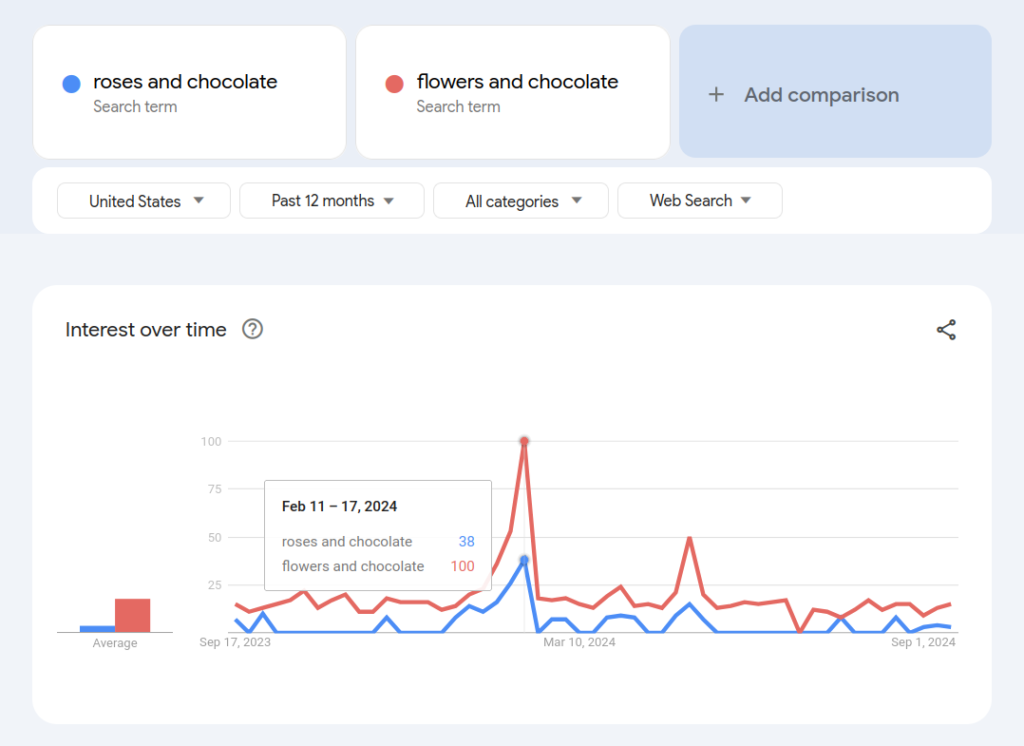
When interpreting data from Google Trends, know that values are not given in absolute figures, but, rather, they are relative to a term’s popularity. That is, numbers on the Interest over time line graph show a search term’s interest relative to the highest point on the chart for the given region and time. A value of 100 is the peak popularity for that term. A value of 50 means that the term is half as popular. A score of 0 means there was not enough data for that term. Scoring Related topics and Related queries is also on a relative scale where a value of 100 is the most commonly searched topic or query, 50 is a topic or query searched half as often as the most popular topic or query, and so on.
Hone your insights and try more specific terms so you can narrow your search from broad to specific markets. (Google Trends even lets you download comma-separated value [.CSV] files, which can be opened as spreadsheet tables for closer inspection.) Use more specific, “long-tail” keywords to reveal niche markets with less competition but high purchase intent. Long-tail keywords are highly specific search phrases usually consisting of three or more words. Unlike broad, highly competitive keywords (which are often just one or two words long), long-tail keywords tend to have fewer searches but attract a highly specific or targeted audience indicating a stronger intent to find or buy what they’re looking for. If people are consistently searching for something very specific (even if in small numbers), it signals an underserved market.
Finally, we’ll cross-reference our trends with other keyword research tools and verify our terms’ search volumes before we validate our findings with other market-research methods. These steps are for the next post.
